
Market Briefing • Global & India Macro Scenario
Stagflation Fears, $100+ Crude & Yield Spikes: Navigating the Transmission Shock to Indian Equities
By 360 Research Desk • Published on September 13, 2026 • 5 min read
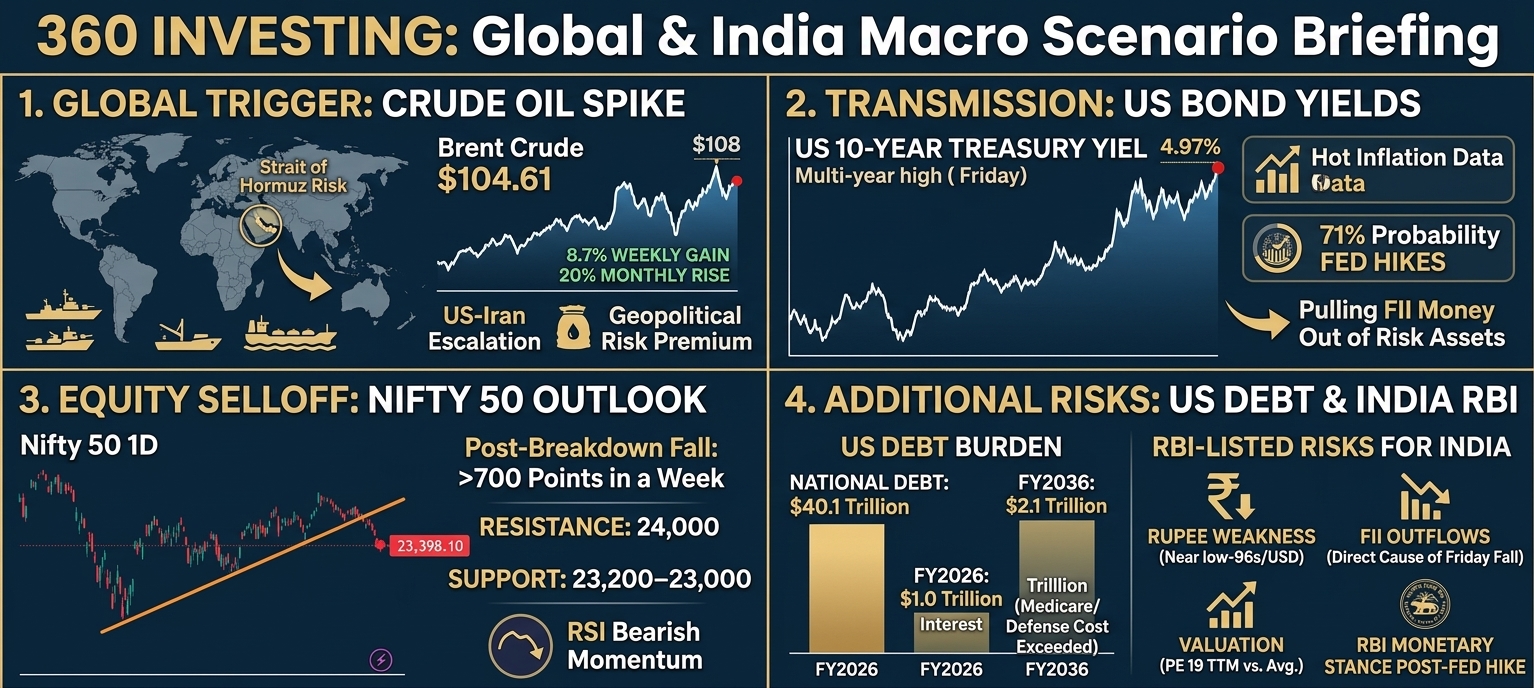
A US–Iran flare-up in the Strait of Hormuz has triggered a classic stagflation scare across global markets. Crude oil has spiked approximately 9% in a single week, US sovereign bond yields have reached multi-year highs, and the Federal Reserve may now hike rather than cut interest rates. While India’s domestic macroeconomic fundamentals remain resilient, this external transmission shock is accelerating foreign institutional outflows from risk assets across Dalal Street.
1. Crude Oil Surge & Volatility: The Geopolitical Catalyst
Energy benchmarks have exploded upward amid military confrontations across the Persian Gulf. Brent settled around $104.61/bbl after touching highs near $108, posting an 8.7% weekly advance. West Texas Intermediate (WTI) closed at $100.05/bbl, gaining 9.4% over the week. Over the past month alone, crude is up nearly 20%, and up ~59% relative to year-ago levels.
The supply scare escalated after retaliatory strikes neutralized five Iranian crude tankers following naval skirmishes, alongside Saudi Arabia temporarily shuttering its critical East-West crude pipeline following drone incursions originating from Iraq. Because the Strait of Hormuz handles roughly one-fifth of worldwide seaborne oil, Goldman Sachs has noted that prolonged logistical disruptions raise the probability of Brent exceeding $120/bbl.
Key takeaway: This rally represents an acute geopolitical risk premium rather than a demand-driven structural cycle. While it can retrace abruptly upon diplomatic progress, it remains the single biggest transmission vulnerability for net energy importers like India.
2. Bond Yields & The Global Bond Selloff: The Transmission Channel
The surge in energy costs has instantly fed through to wholesale producer prices. With core US CPI accelerating 0.3% month-on-month—above consensus expectations—expectations for central bank monetary easing have dissolved.
The US 10-year Treasury yield surged to 4.97%, testing levels unseen since October 2023. Concurrently, the 30-year yield touched 5.25%–5.30%, printing multi-decade peaks last recorded in 2007. Similar yield spikes have materialized across Germany, France, Japan, and the United Kingdom.
Money markets have swiftly repriced terminal interest rates, assigning a 71% probability that the Federal Reserve will implement a 25-basis-point rate increase rather than an easing measure. Furthermore, the US Treasury's expanded debt buyback took down just $5.2 billion against a $6 billion cap (and $10.5 billion tendered), confirming tepid investor demand for long-dated paper.
When risk-free dollar yields hover around 5%, the required return on equity spreads widens substantially. Sovereign debt begins to compete directly with equities, forcing institutional rebalancing and pulling Foreign Institutional Investor (FII) liquidity straight out of emerging markets.
3. Equity Selloff: Nifty 50 Technical Structure & Levels
Spillover weakness from Wall Street—where the Dow marked a multi-day slide—triggered a severe technical breakdown across Indian benchmarks. After decisively breaching the psychological 24,000 barrier, the Nifty 50 plummeted over 700 points in one week, driving spot prices down toward the 23,200 – 23,000 support pocket.
From a structural perspective, the index is now trading below its critical 200-day Exponential Moving Average (EMA at 24,039.42), confirming that the prevailing medium-term momentum has transitioned into a "Sell on Rise" structure.
The daily Relative Strength Index (RSI) has compressed to 27.22 (with its signal average at 38.50). While this deep oversold status can prompt sharp relief bounces, overhead supply near 24,000 to 24,040 will act as formidable resistance for any counter-trend pullbacks.
4. Structural Pressure: The $40.1 Trillion US Debt Burden
Compounding bond market vulnerability is the persistent expansion of US sovereign liabilities. Total national debt stands at roughly $40.1 trillion, with public debt on pace to touch $32.2 trillion (approx. 100.4% of GDP) by the end of fiscal 2026. The FY2026 fiscal deficit is projected at $1.89 trillion, or 5.9% of GDP.
Annual net interest payments reached $970 billion in 2025 and will top $1.0 trillion in 2026, surpassing national defense expenditures and Medicare. By 2036, debt servicing is projected to reach $2.1 trillion annually. This relentless issuance schedule keeps long-duration sovereign yields elevated, anchoring global cost of capital higher.
5. Key Transmission Risks Flagged for the Indian Economy
The Strait of Hormuz standoff functions as the central conduit connecting global energy, bond yields, and domestic liquidity. The Reserve Bank of India and institutional desks are monitoring four specific transmission channels:
- Valuation & Breadth: The Nifty 50 trades around 19x 12-month trailing earnings, aligned with historical averages. However, broader market breadth remains fragile, leaving mid- and small-cap segments vulnerable to multiple contraction.
- Rupee Vulnerability: The Indian Rupee continues to drift toward the low-96/USD zone. Sustained currency weakness expands the landed cost of imports, creating imported inflation pressure unless broader commodities offset the oil spike.
- FII Capital Outflows: Surging US risk-free yields paired with geopolitical de-risking generate direct foreign institutional selling pressure on Dalal Street.
- RBI Policy Stance: Should the Federal Reserve follow through with a rate hike to counter energy inflation, the RBI will likely have to defer interest rate cuts or intervene via liquidity windows to preserve currency and yield spreads.
Strategic Roadmap for Investors
Until the Nifty 50 reclaims and consolidates above the 200 EMA at 24,000 – 24,040, tactical positions should respect the prevailing downward trendline.
The 23,200 – 23,000 band serves as primary structural support. Long-term investors can utilize phased, staggered allocations into fundamentally sound businesses with strong domestic balance sheets, while closely monitoring diplomatic developments in the Persian Gulf for signs of an oil risk premium reversal.
Frequently Asked Questions
Why is the Nifty 50 falling despite resilient domestic growth?
The decline is driven by an external liquidity shock. Elevated US Treasury yields (10Y near 4.97%) and $104+ crude oil force foreign institutional funds to reallocate into risk-free dollar assets, causing FII outflows from Indian equities.
What are the critical Nifty 50 levels to watch?
Overhead resistance sits at 24,000 to 24,040 (prior breakdown zone & 200 EMA). Primary support is pegged at the 23,200 to 23,000 base.
How does crude above $100 affect the Rupee?
India imports more than 85% of its oil. Elevated oil prices widen India's trade deficit and increase dollar demand, weakening the Rupee toward the low-96/USD level.